SensMax EasyReport Next User Manual

SensMax EasyReport Next Description
SensMax EasyReport Next is a desktop application for Windows designed to process and display visitor attendance statistics. The program is a mandatory component for autonomous (offline) visitor counting systems and optional for network (online) systems. You can also use EasyReport Next as a convenient supplement to the SensMax SensWeb cloud reporting service.
EasyReport Next is a direct evolution of the previous software version - EasyReport Pro. We modernized the platform, updated the interface, and significantly simplified the licensing process, making the program more modern and intuitive.
With EasyReport Next, you can group sensors by stores, cities, and regions, as well as generate visual charts and detailed tabular reports. The program supports data import from cash registers, allowing you to create comprehensive financial reports by linking sales data with actual attendance.
For your convenience, EasyReport Next features flexible data export to all popular formats. You can export reports manually or automatically on a schedule.
License Activation
Upon the first launch of SensMax EasyReport Next, a window will appear prompting you to enter your license key. Note: your computer must be connected to the Internet for successful license activation. Immediately after entering a valid key, the program will be ready to use.
License Deactivation
This function is necessary if you plan to transfer your license from an old computer to a new one.
Important: each license can be activated and deactivated a maximum of 10 times. If this limit is exceeded, the license will be blocked permanently.
To deactivate a license:
- Launch SensMax EasyReport Next.
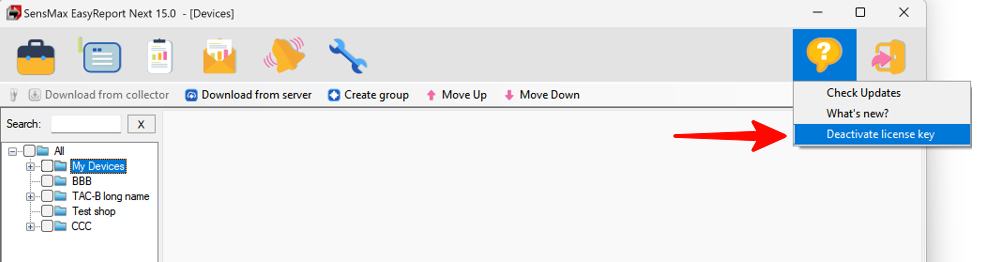
- In the top menu, click the Help button.
- Select Deactivate license key.
EasyReport Next Interface Overview
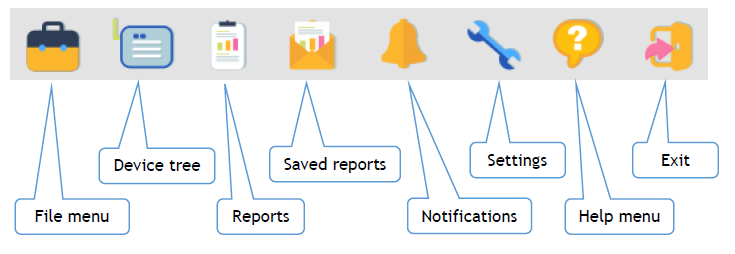
Main Menu
- File menu - database management, import, and export.
- Device tree - sensor list management and grouping.
- Reports - creating new analytical reports.
- Saved reports - quick access to previously saved report templates.
- Notifications - viewing system messages and warnings.
- Settings - program configuration and export schedules.
- Help menu - program information and license management.
- Exit - close the application.
File Menu
The main features of the File menu are presented in the table below:
| Function | Description |
|---|---|
| Import sensmax file | Import *.sensmax files. Useful if you received a database file via email. |
| Export counter base | Export the entire database to a *.sensmax file (e.g., to transfer to another computer). |
| Open database folder | Open the system folder on your computer where the program's database is physically stored. |
| Open saved reports folder | Open the folder containing saved reports. |
| Languages | Select the interface language. |
| Import cash register | Manual data import from cash registers. |
| Remove selected sensors | Delete selected sensors from the database. |
| Create group | Create a new group (e.g., "Mall Gallery") in the device tree. |
| Force update | Force immediate download of new data from the server. |
| Import Settings | Import *.dat settings for integration with the SensMax AdminTools utility. |
| Download from Server | Download data from the SensWeb system, an FTP server, or a local/network folder (the source is configured in settings). |
| Download from collector | Direct data download from a manual SensMax SE data collector connected via a USB cable. |
| Export all database to... | Full database export to XLS, XML, or CSV formats. |
| Export current data to CSV | Export the currently open report to CSV. |
| Export current data to PDF | Export the currently open report to PDF. |
| Export current data to XLS | Export the currently open report to XLS (Excel). |
| Exit | Close the program. |
Settings Menu
This section contains the core configuration parameters of the program.
| Function | Description |
|---|---|
| General Settings | Basic application settings and data import source selection. |
| SE/DE Collector Settings | Configuration settings for direct SE/DE data collector connection. |
| Auto-export schedule | Schedule setup for automatic background report export to a specified folder. |
| Cash register format editor | Format editor for importing data from POS (cash register) terminals. |
Note: data from cash registers is not downloaded automatically; it must be imported into the program manually.
Device Tree Management
For ease of use, all sensors in the program are organized in a tree structure. You can group them logically (by stores, floors, or cities), rename them, and apply individual settings.
To open this menu, click the Device tree button.
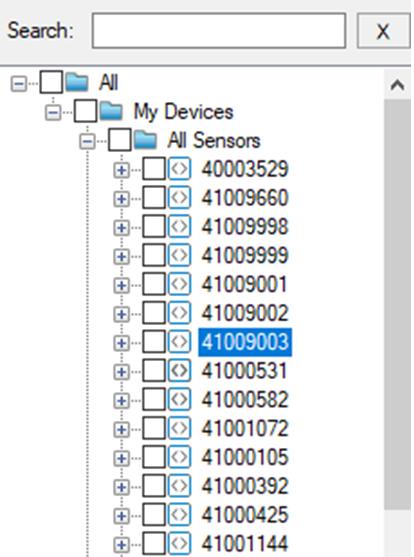
Upon the first data download, all detected sensors are placed in the common All sensor root group by default. If a sensor hasn't been named yet, its serial number is displayed instead.
To create a new group, click the Create group button. A folder named New Group will appear in the list. Click on it to set a meaningful name.
Sensors can be easily distributed into groups using simple Drag-and-Drop with your mouse.
You can also arbitrarily change the order of groups and the sensors within them. Simply select the desired element and drag it to a new location. To completely delete a sensor or an entire group, right-click the element and select Remove.
Sensor Adjustments (Preferences)
You can assign a clear name to each sensor based on its location, as well as set individual operational parameters. Left-click on the desired sensor - the Preferences panel will open on the right side of the window.
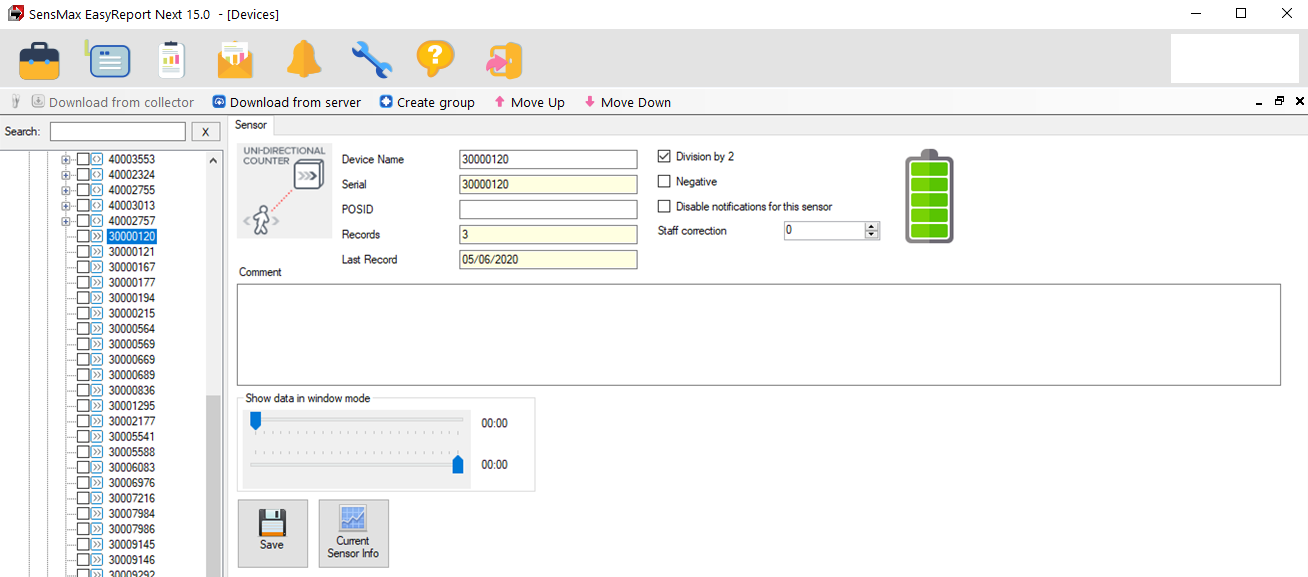
In the Comments field, you can leave any important text notes: exact installation address, store manager's contact phone number, etc. Attention: the program does not allow using identical names for different sensors to avoid confusion. After making changes, be sure to click the Save button to apply them.
Additional sensor options:
-
Division by 2 When this option is enabled, all sensor readings are divided exactly in half. Since a basic infrared sensor records any beam crossing (both in and out), and a visitor always eventually leaves the premises, this checkbox must be enabled for stores with a combined entrance and exit. However, if the premises have separate doors for entering and exiting with individual sensors installed on them, this option should be disabled.
-
Negative Used in specific scenarios when a certain area needs to be excluded from the general visitor flow. Example: There is a separate service center inside your store. You need to count only the store's shoppers, excluding those who visited the service center. You install one sensor at the main entrance and a second one at the service center entrance. Both sensors are placed in the same group in the program, but the "Negative" checkbox is enabled for the service sensor. As a result, the program will automatically subtract the service center visitors from the store's total flow.
-
Disable notifications for this sensor Blocks the display of system notifications (e.g., low battery warnings) specifically for this sensor. They will stop cluttering the Notifications tab.
-
Staff correction Allows you to set a fixed number of crossings that will be deducted daily from the overall statistics to filter out employee movements. Example: You know that two salespeople in your store go out for lunch and smoke breaks daily, making a total of 8 beam crossings per day. You can enter the number 8 in this field, and the program will stop counting these 8 staff movements in the final reports.
Working with Reports
To generate analytics, you must first specify which stores or sensors you want to get data for.
Click the Reports button. In the tree that appears, check the boxes for the desired sensors or entire groups.
If you check an entire group, the program will automatically sum up the indicators of all sensors nested within it (you will still be able to view the statistics of each individual sensor).
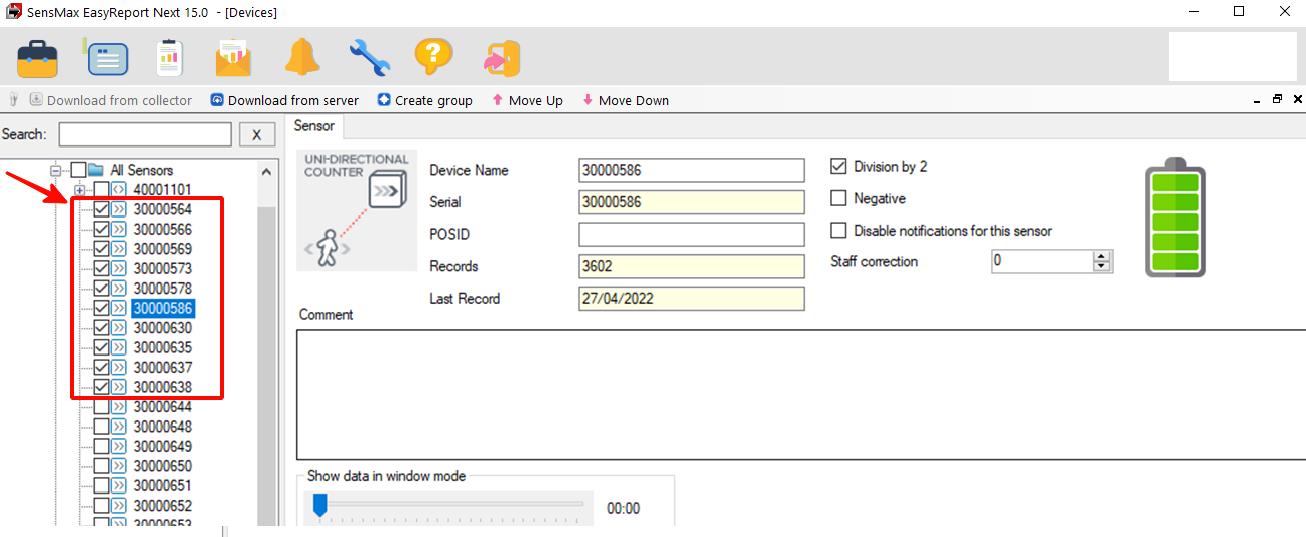
After selecting the objects of interest, click the Create report button to open the main reporting window.
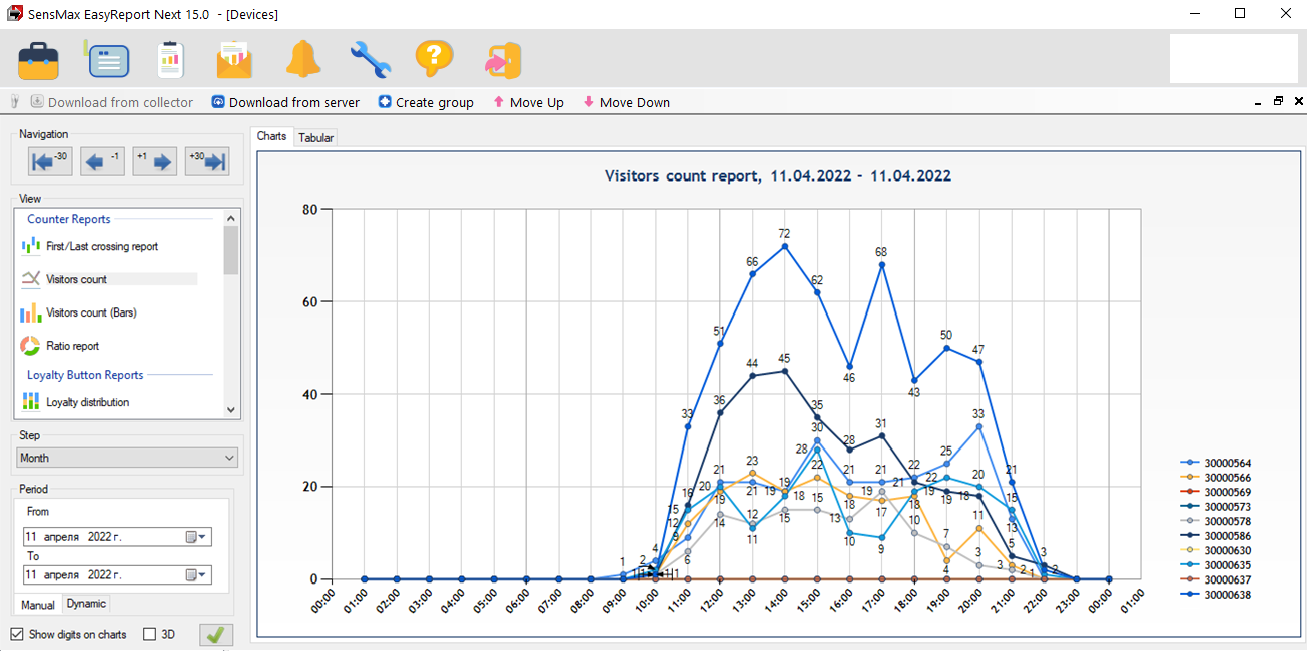
All display management tools are located on the left panel:
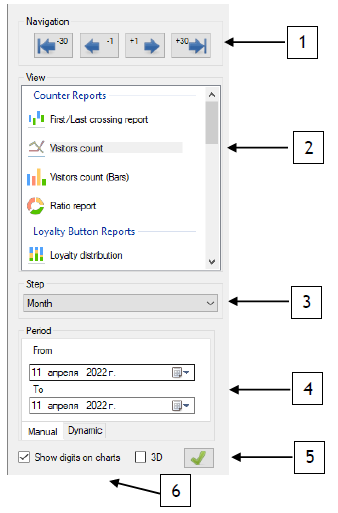
[1] Time navigation buttons Allow you to quickly "rewind" the report period back and forth without opening the calendar.
-
Shift exactly one month (-30 or +30 days):

-
Shift exactly one day (-1 or +1 day):

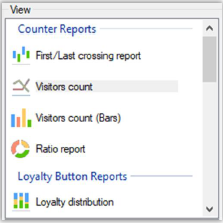
[2] Report type selection
Click on the desired name to select the type of report to generate. The currently active report is highlighted in color.
[3] Report Step
This parameter determines the chart's scale: you can view aggregated data by hours, days, weeks, or years. Simply select the desired interval from the Step drop-down list.
[4] Period selection Two calendars are used to set exact time frames: the first sets the start date, the second - the end date. If you select the same day in both calendars, the program will build a detailed hourly report for that day.
[5] Create report button After you have configured all parameters (dates, type, step), you must click this button to apply changes and redraw the charts.
[6] Visual chart settings
- Show digits on charts - displays exact numerical values directly above the chart columns or lines. Note: enabling this option with a large amount of data may slightly slow down chart rendering.
- Three-dimensional view mode (3D) - makes charts voluminous for a more impressive presentation.
Additional Analysis Tools
The program provides a number of convenient features for a more detailed study of the collected statistics.
Chart-table switching
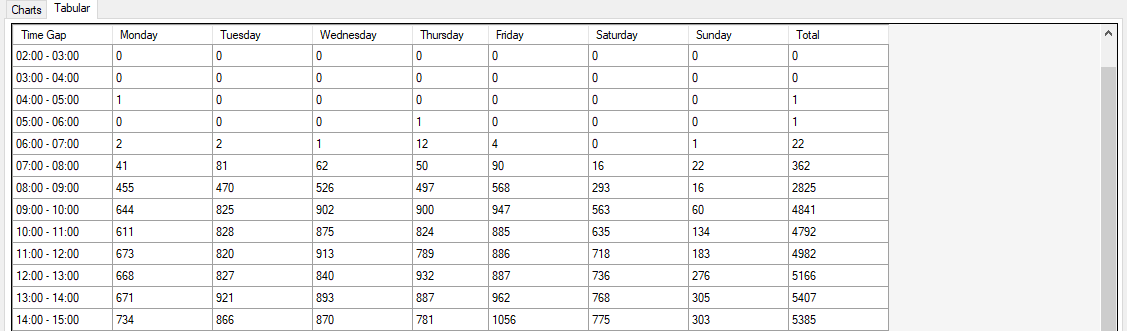
Any created report can be viewed both as a visual chart (Charts tab) and as a strict table with numbers (Tabular tab). The tabular view is often useful when you need to copy specific numbers for third-party reports.
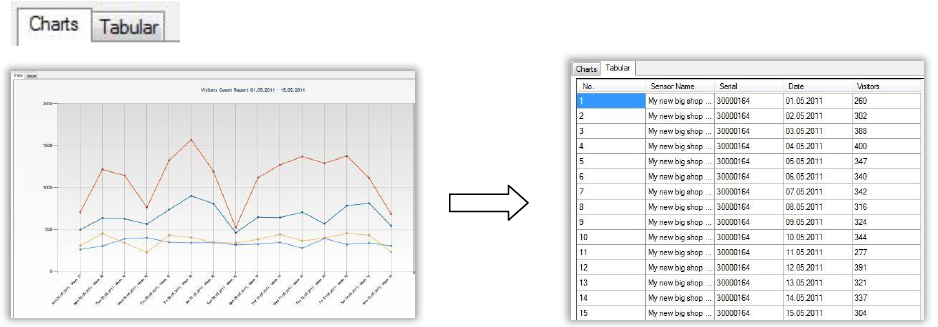
Chart Zooming
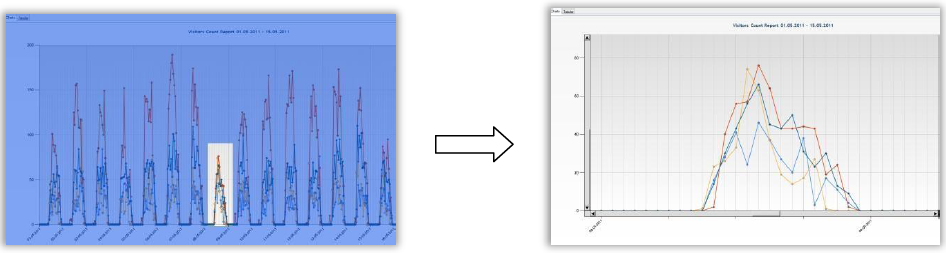
If you are interested in a specific peak on the chart, highlight this area with your mouse cursor while holding down the left button - the program will magnify this fragment to full screen.
To return to the standard 100% scale, right-click on the chart and select Reset Zoom.
3D Chart Rotation
If you have enabled the three-dimensional mode, a projection adjustment tool will appear on the panel. You can use it to rotate the chart at any angle to find the best perspective.

Tooltips
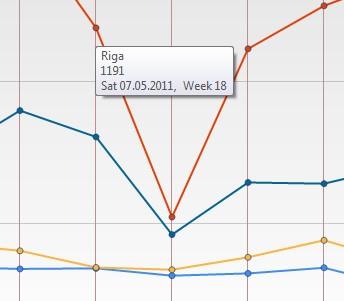
Simply hover your mouse cursor over any point or column on the chart to see a detailed information summary: exact date, day of the week, sensor name, and number of visitors.
Counter Reports Description
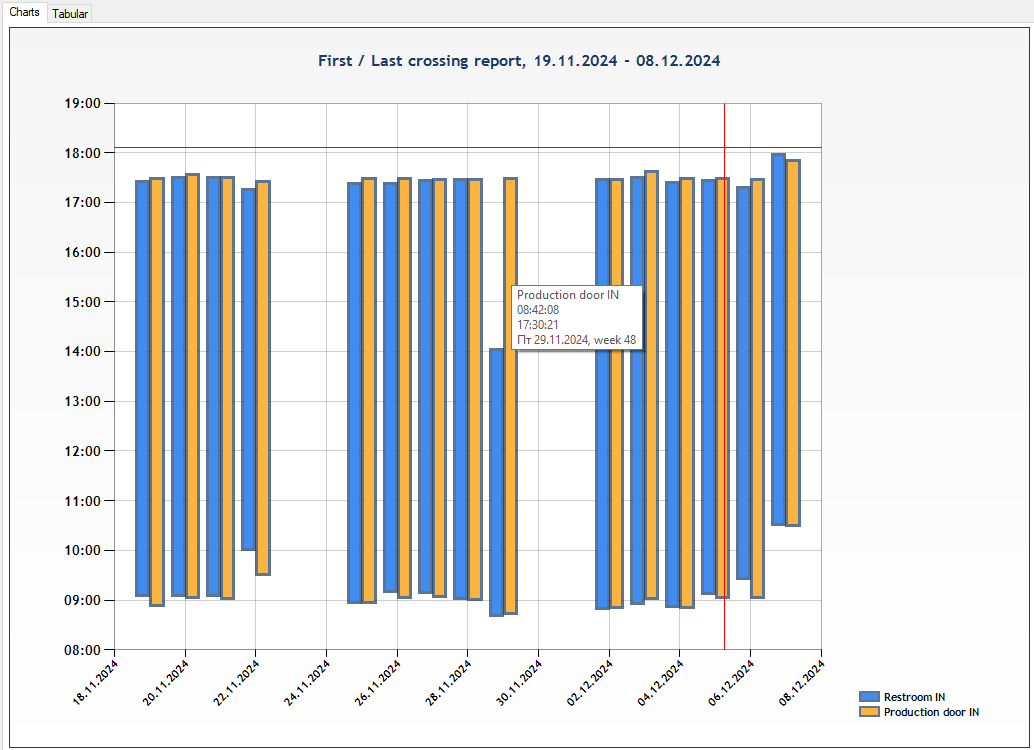
First/Last crossing report SensMax sensors record the time when the first and last visitor passed them per day with up to a second precision. Effectively, this allows you to monitor the actual opening and closing times of the store. The chart helps to quickly visually identify staff lateness (empty spaces on the chart), while the table provides an exact minute-by-minute summary.

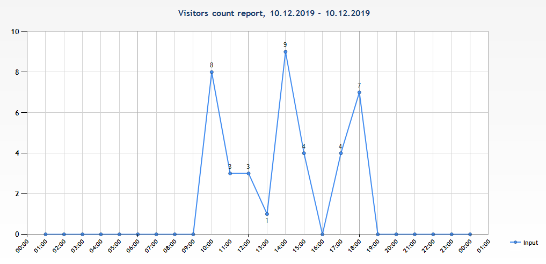
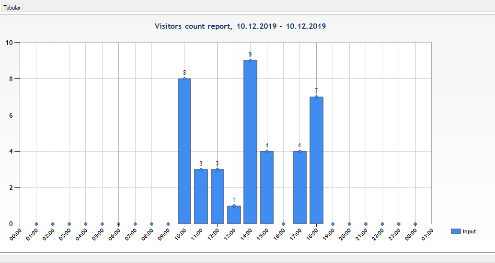
Visitor number report (lines/columns) The basic and most popular report. Displays attendance statistics for the selected period as a line chart or histogram (vertical columns).
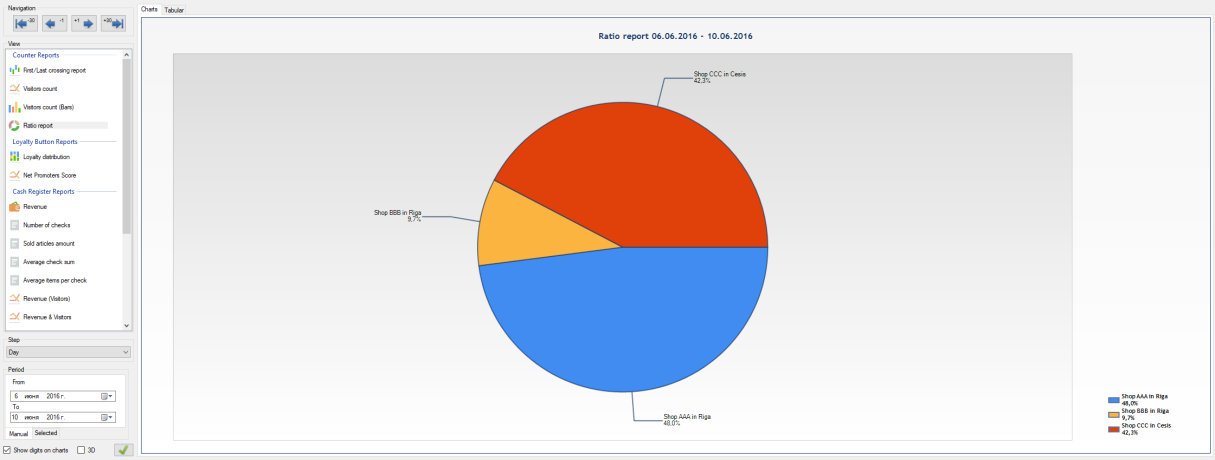
Ratio report A pie chart that visually demonstrates the percentage share of a particular store (or zone) in the total visitor flow of the network during the specified time.
Loyalty Button Reports
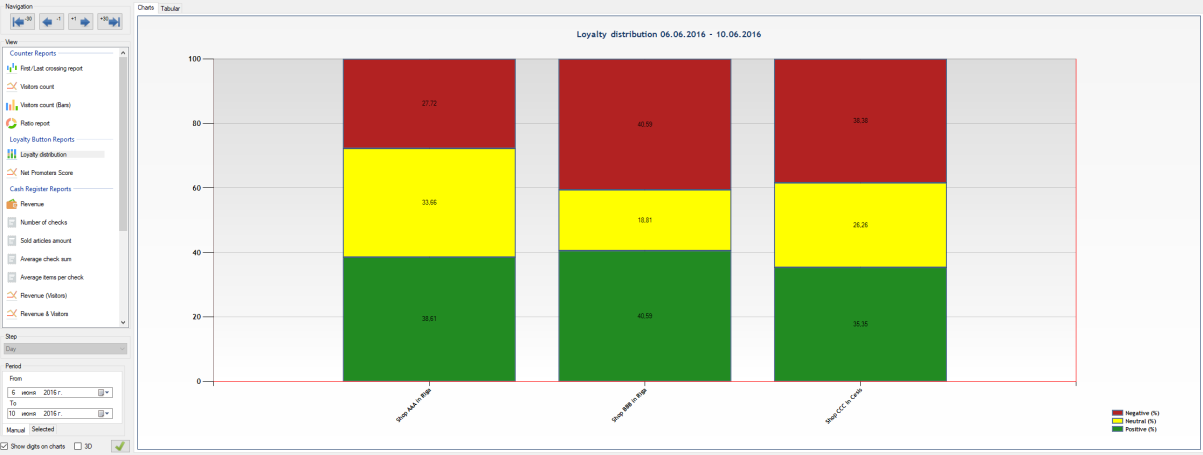
Loyalty distribution
Displays the percentage ratio of visitors who pressed the green, yellow, or red button (rating service satisfaction) over the selected time period.
Net Promoters Score (NPS) A powerful analytical tool for assessing the quality of your business based on the international NPS methodology.
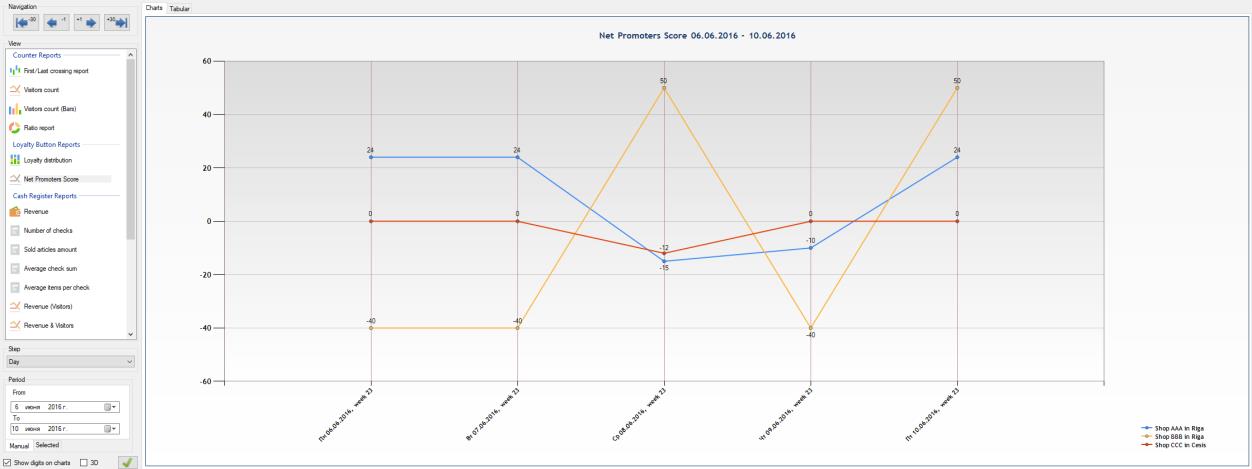
The NPS index is a generally accepted metric that assesses clients' willingness to recommend your company to friends and acquaintances.
The calculation formula is extremely simple:
NPS = Promoters (%) - Detractors (%)
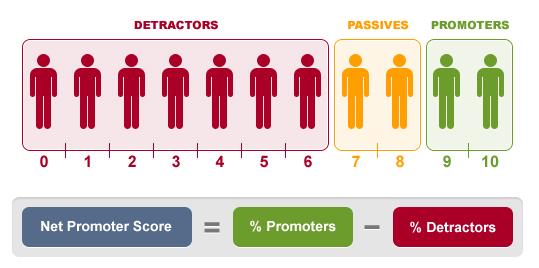
- Promoters (Green button) - loyal customers who liked everything and are ready to recommend you.
- Detractors (Red button) - dissatisfied customers who are highly likely to leave a bad review.
- Neutral ratings (Yellow button) do not participate in calculating the index itself, as such clients bring neither pronounced benefit nor harm to the brand.
A high and positive NPS index indicates that the company is growing through word of mouth. A low or negative index is a signal for urgent improvement of business processes and additional staff training.
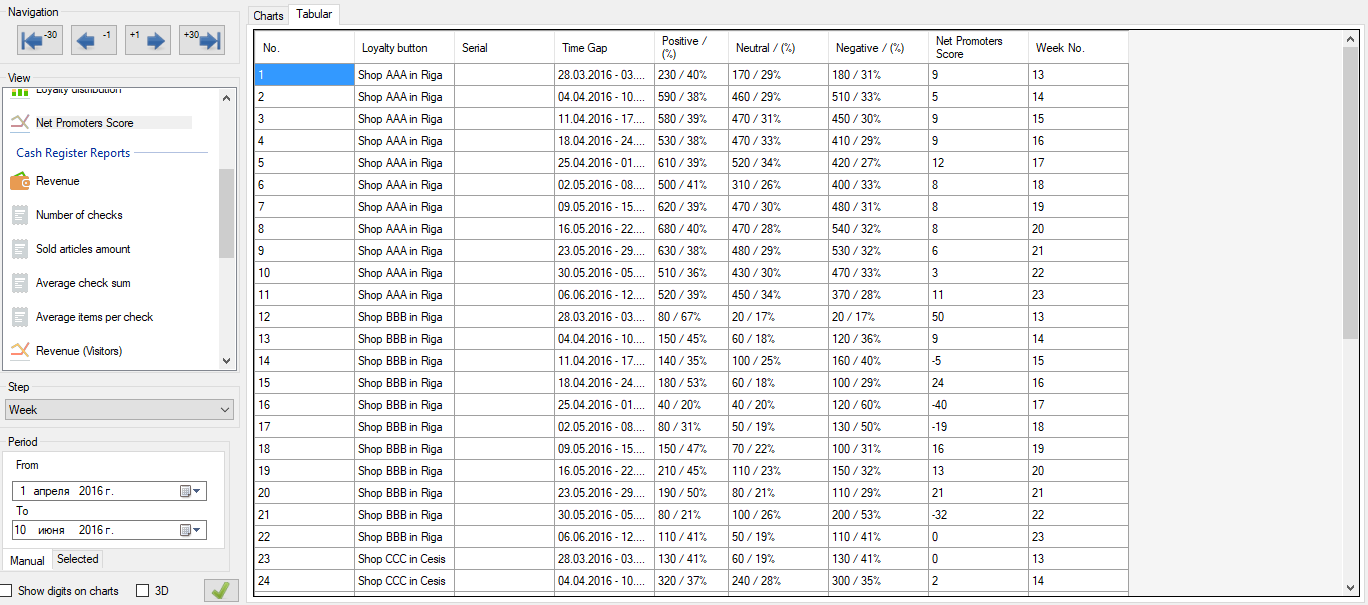
All button press data is also available in a convenient table broken down by days.
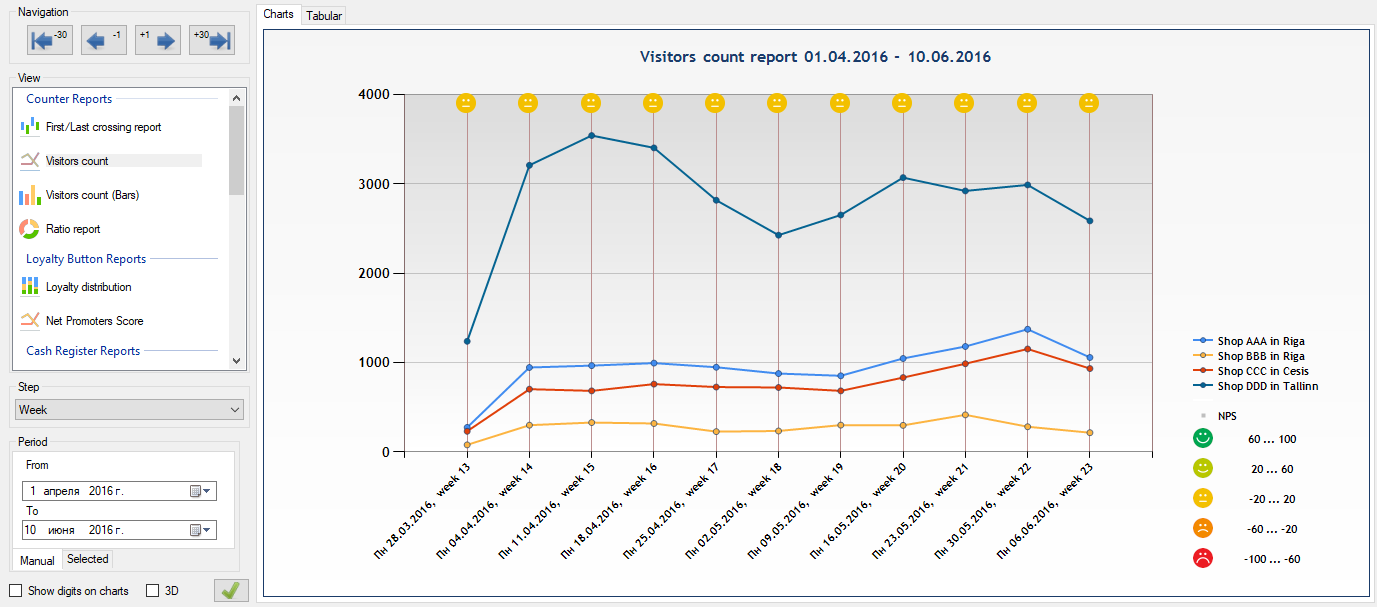
Tip: If you select both a loyalty button and an entrance visitor counter in the device tree when generating a report, you will get a combined Visitors count report, showing both the visitor flow and their satisfaction index on a single chart.
Cash Register Reports
If you have imported data exports from cash registers into the program, EasyReport Next will allow you to compare attendance with actual sales, automatically calculating conversion rates, average check value, and other business metrics. There are 8 types of financial reports available to the user.
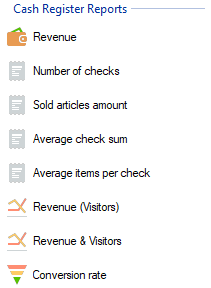
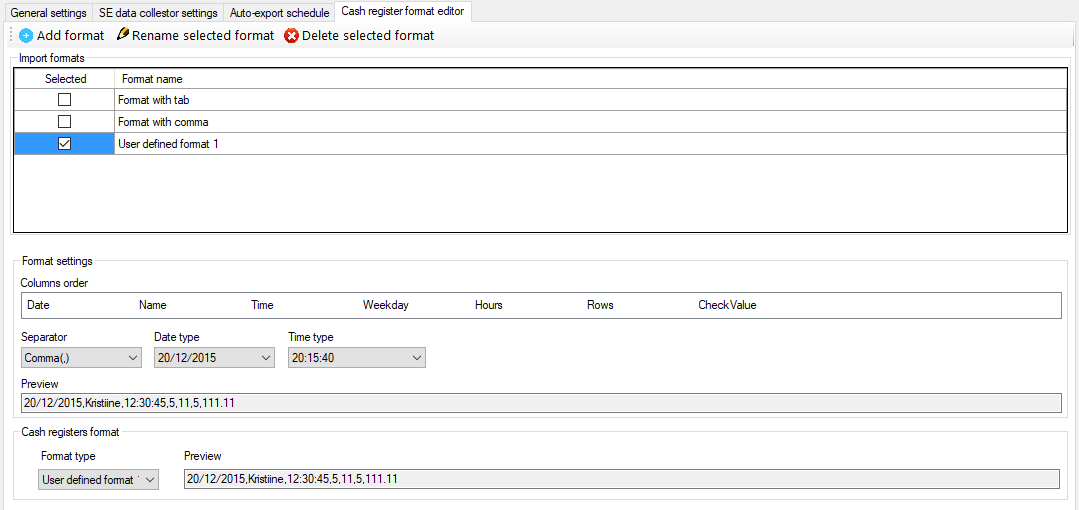
Since there is a huge number of different cash register systems in the world with unique data export formats, the program includes a flexible parser constructor. To teach the program to understand files from your cash register, go to the Settings -> Cash register format editor menu:
Complex Reports
These reports are designed for deep analytics of large data sets. They display information that has already undergone complex programmed sorting.
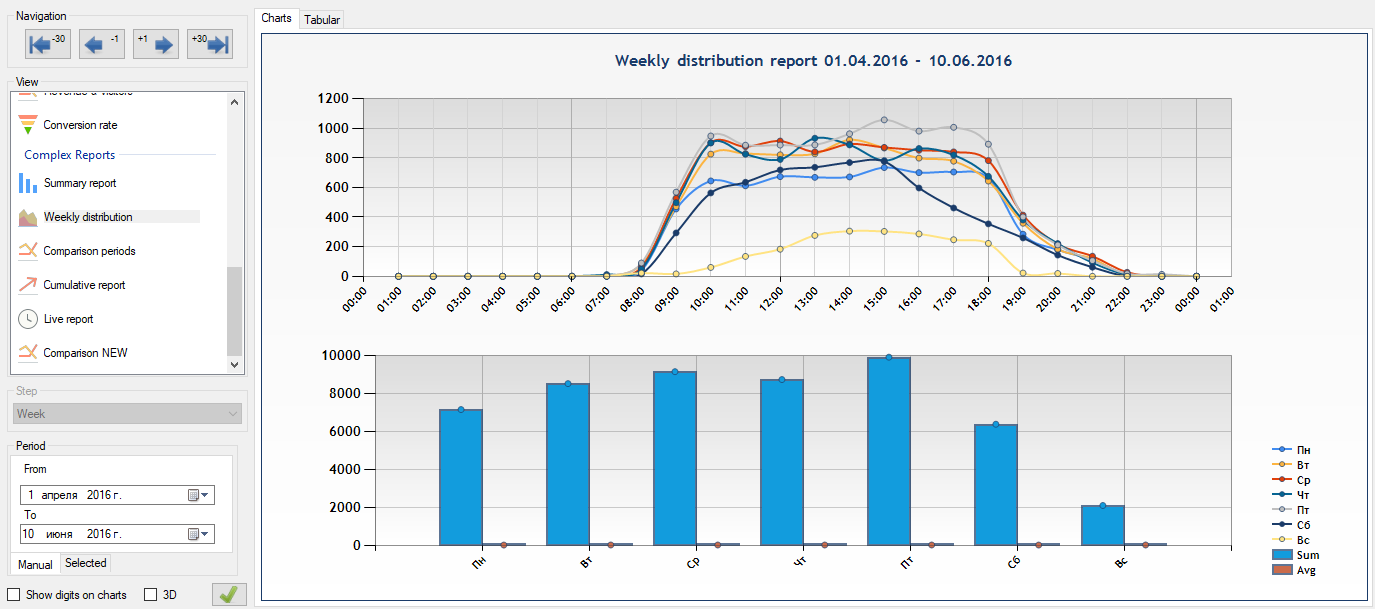
Weekly distribution The chart consists of seven multi-colored lines (one for each day of the week), distributed by working hours. If multiple stores are selected at once, the data will be averaged or summed up.
Usage example: You select all 10 stores in your network and a period of 1 year. Seven lines appear on the chart, showing the "average week" of your network for an entire year. This helps identify global long-term trends. For example, you might see that traffic is minimal on Tuesdays and Wednesdays from 10:00 to 12:00. Based on this data, you can optimize staff shifts, saving on payroll without compromising sales.
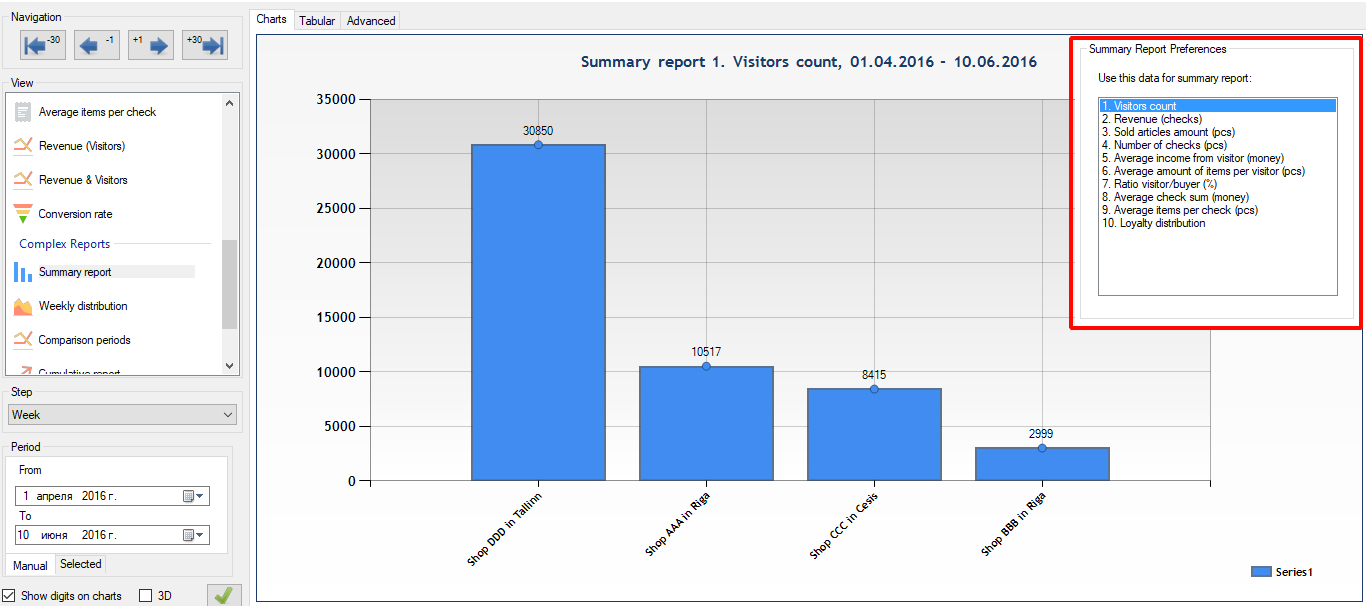
Summary report
A bar chart that ranks stores (from best to worst) based on one of the selected parameters over a specific period.
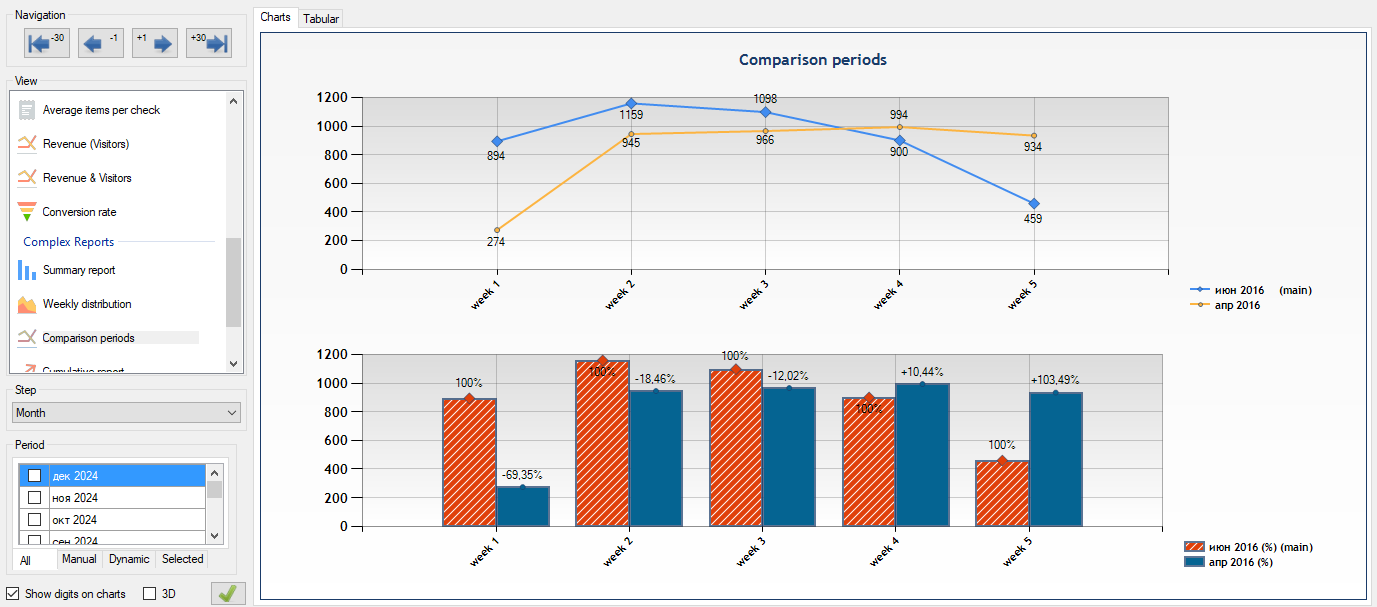
Comparison periods
Allows you to visually overlay data for different time periods. An excellent tool for evaluating the effectiveness of advertising campaigns (for example, you can compare the current month with the previous one, or this year's seasonal sales with last year's).
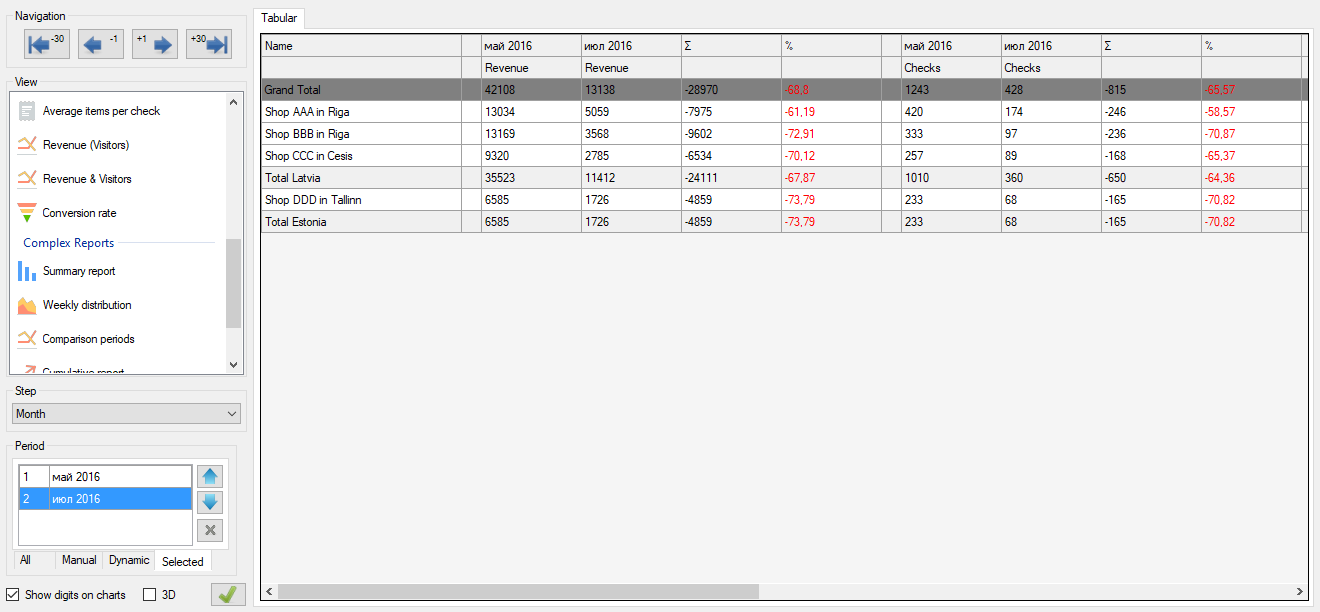
Comparison new
An improved version of the Comparison periods report, which additionally can compare financial conversion indicators (incorporating cash register data). It is generated exclusively in tabular form for easy export.
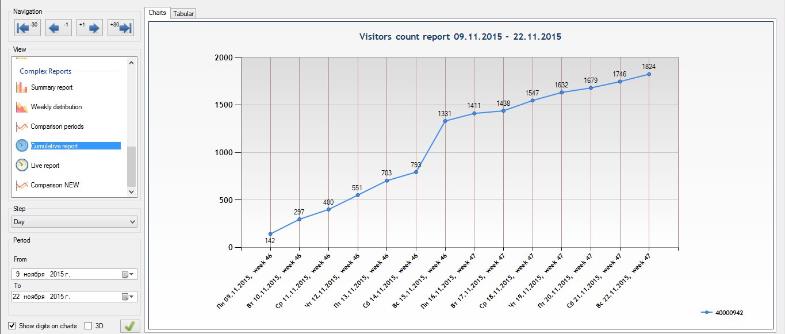
Cumulative report
A chart of continuous attendance growth. Each subsequent point on the chart is added to the previous one, visualizing the accumulated volume of visitors since the beginning of the selected period.
Appendix 1. Complete Uninstallation of the Program
If you need to completely uninstall EasyReport Next, you can choose one of two methods.
Method 1 (Recommended) Use the standard Windows "Add or Remove Programs" tool (via Control Panel or System Settings).
Method 2
- Open the system folder where the program was installed (by default, this is
C:\Program Files (x86)\SensMax\EasyReportNext). - Run the
unins000.exefile and follow the on-screen instructions.
Clearing Residual Files After standard uninstallation (using either method), service files and old databases may remain on your computer. To completely clean the system, manually delete the following system folders:
- The program folder itself:
C:\Program Files (x86)\SensMax\EasyReportNext - The database folder:
C:\Users\USERNAME\AppData\Local\EasyReportNext
Contacts
- Phone: +371 67553110
- Email: office@sensmax.lv
- Website: www.sensmax.eu
- Telegram: t.me/sensmax
- Facebook: facebook.com/sensmaxmanufacturer
- LinkedIn: linkedin.com/company/sensmax
SensMax is a registered trademark. SensMax reserves the right to make changes to the products described herein without prior notice. The information contained in this publication regarding device applications is provided solely for your convenience. SensMax disclaims all liability arising from the use of this information. The use of SensMax devices in life-support systems and/or safety-critical applications is carried out entirely at the buyer's risk.